2020 census shows big intrastate shifts in population, and a more diverse Midwest
Ten of the 11 Midwestern states increased in population while all became more urban and got more diverse, according to the 2020 Census.
The region as a whole (Missouri included) grew by 3.1 percent, to 68,985,454 people, over the past decade — the lowest rate of growth among the four regions (see table).
Illinois remains the Midwest’s most populous state, with 12,812,508 people, but was the only state in the region to lose people (down 0.1 percent). North Dakota is still the Midwest’s least populous state but had the highest growth rate, 15.8 percent (now a total of 779,094 residents).
Within states, urban and suburban areas either generally gained population or grew at faster rates than rural areas, many of which lost people between 2010 and 2020.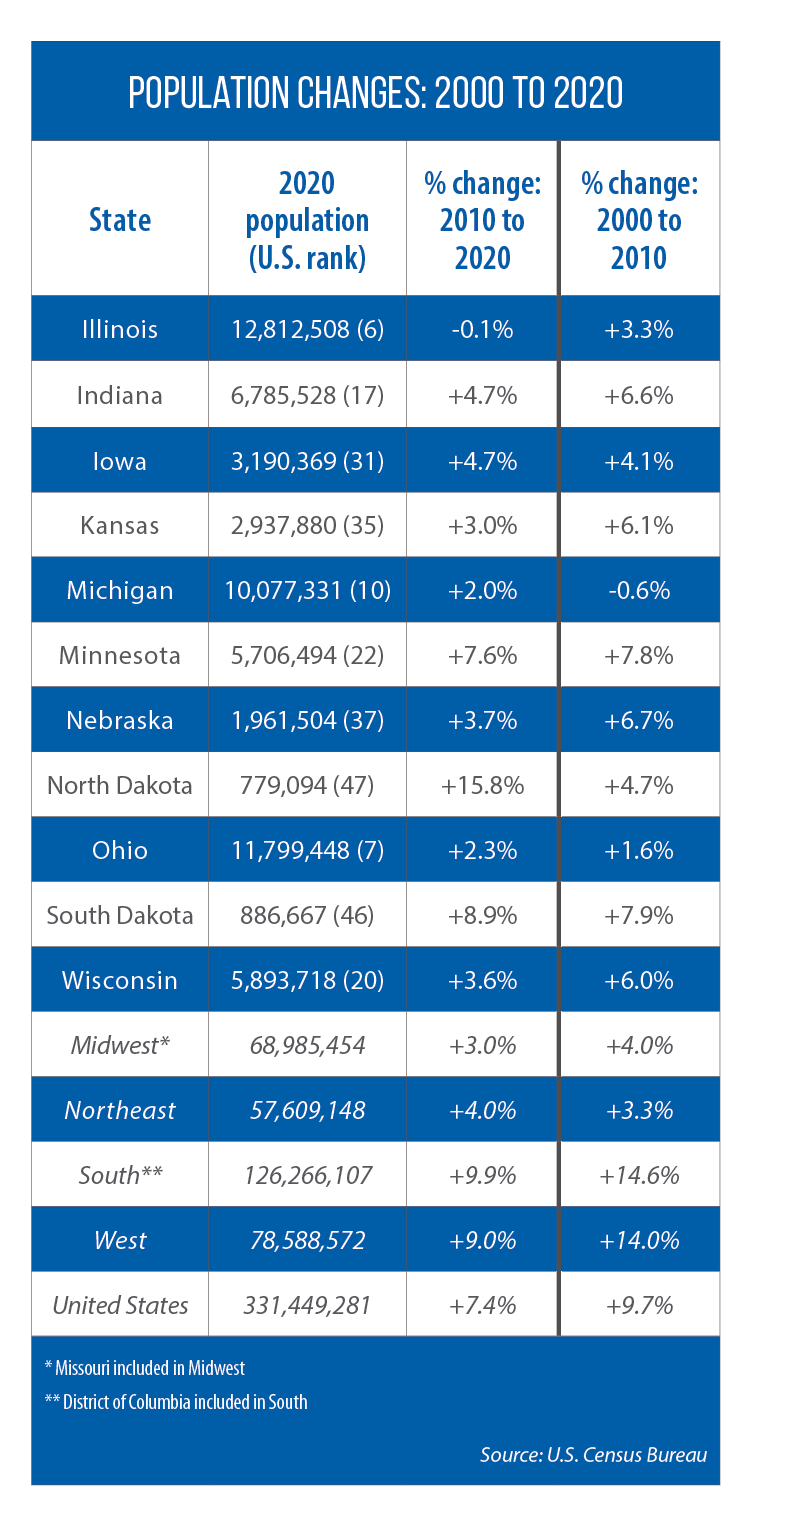
North Dakota is a notable exception: while Cass County — home to Fargo, the state’s largest city — grew by more than 20 percent, so did seven western rural counties, thanks to the state’s oil boom.
More typical for the Midwest is the population pattern being seen in Kansas.
“The five fastest-growing counties in Kansas — Pottawatomie, Johnson, Wyandotte, Leavenworth and Douglas — grew by 10.4 percent on average,” the Kansas Health Institute noted in an August article. “All five counties are located in the northeast part of the state, and all but Pottawatomie are urban. Sedgwick County, which includes Wichita and is the second most populous county in the state, grew 5.1 percent.”
More legislative seats for metro areas
In Nebraska, which grew 7.4 percent to 1,961,504 people, most of the population increase was concentrated in just three urban counties: Sarpy (20 percent) and Douglas (13 percent) in the Omaha metropolitan area, and Lancaster (up 13 percent), home to the state capital, Lincoln.
One consequence of those population trends: the potential for an urban-majority Nebraska Unicameral Legislature in the decade ahead, once the state’s new political boundaries are in place after redistricting, David Drozd, research coordinator at the University of Nebraska at Omaha’s Center for Public Affairs Research, told the Associated Press.
A similar shift in intrastate balances of power is likely to play out in South Dakota, where much of the state’s overall 8.9 percent growth (up to 886,667 people) was concentrated in counties containing the state’s largest city and its suburbs: Minnehaha County (home to Sioux Falls), 16.4 percent; and Lincoln County (suburban Sioux Falls and part of the city), 45.4 percent.
South Dakota lawmakers on redistricting committees must now figure out how to redraw 35 legislative districts, each containing as close as possible to 25,300 people, before a scheduled special session in November to approve the new maps.
In Ohio, where a new bipartisan process for redrawing state legislative and congressional districts is in place for the first time, more legislative power will shift toward the Cincinnati and Columbus metropolitan areas.
The population of Columbus itself jumped by 15.1 percent, and population growth was 20 percent or more in two counties adjacent to Ohio’s largest city. Cincinnati grew by a more-modest 4.2 percent, but in nearby Warren County, the number of residents increased by 13.9 percent between 2010 and 2020. 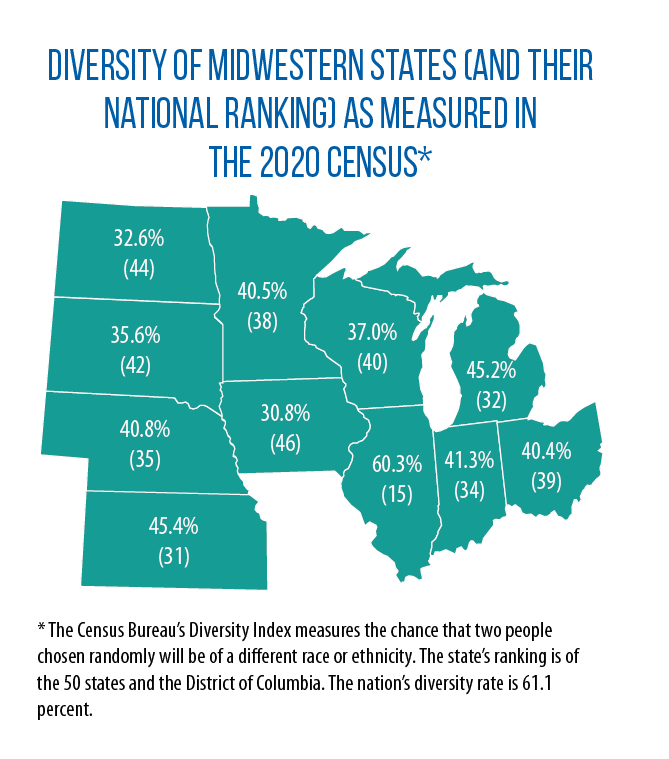
Impacts of diversifying population
Over the past decade, the United States became more diverse, with a rise in the number of “majority minority” counties (meaning most of the population is non-white). Minority populations also grew in almost every county in the Midwest.
David Egan-Robertson, a demographer at the University of Wisconsin-Madison’s Applied Population Lab, cautions that some comparisons of racial and ethnic diversity to previous U.S. Census results aren’t possible due to a “sea change” in how the bureau captures and reports such data.
Previous censuses offered as racial/ethnic identifiers White, Black or African American, Hispanic or Latino, Asian, Native Hawaiian or Other Pacific Islander, American Indian or Alaska Native.
In 2020, those categories were tweaked to add “alone” to all options except Hispanic or Latino, and new multi-racial options were added.
In previous years, Egan-Robertson says, the Census Bureau programmed optical scanners to read only the first 30 characters of a census form’s answer box; but the 2020 census had an online response option which meant up to 200 characters could be read, and more self-reported data could be sought.
“Was there this much racial and ethnic diversity in 2010? Maybe the diversity was there in 2010, but the Census just didn’t capture it very well,” he adds.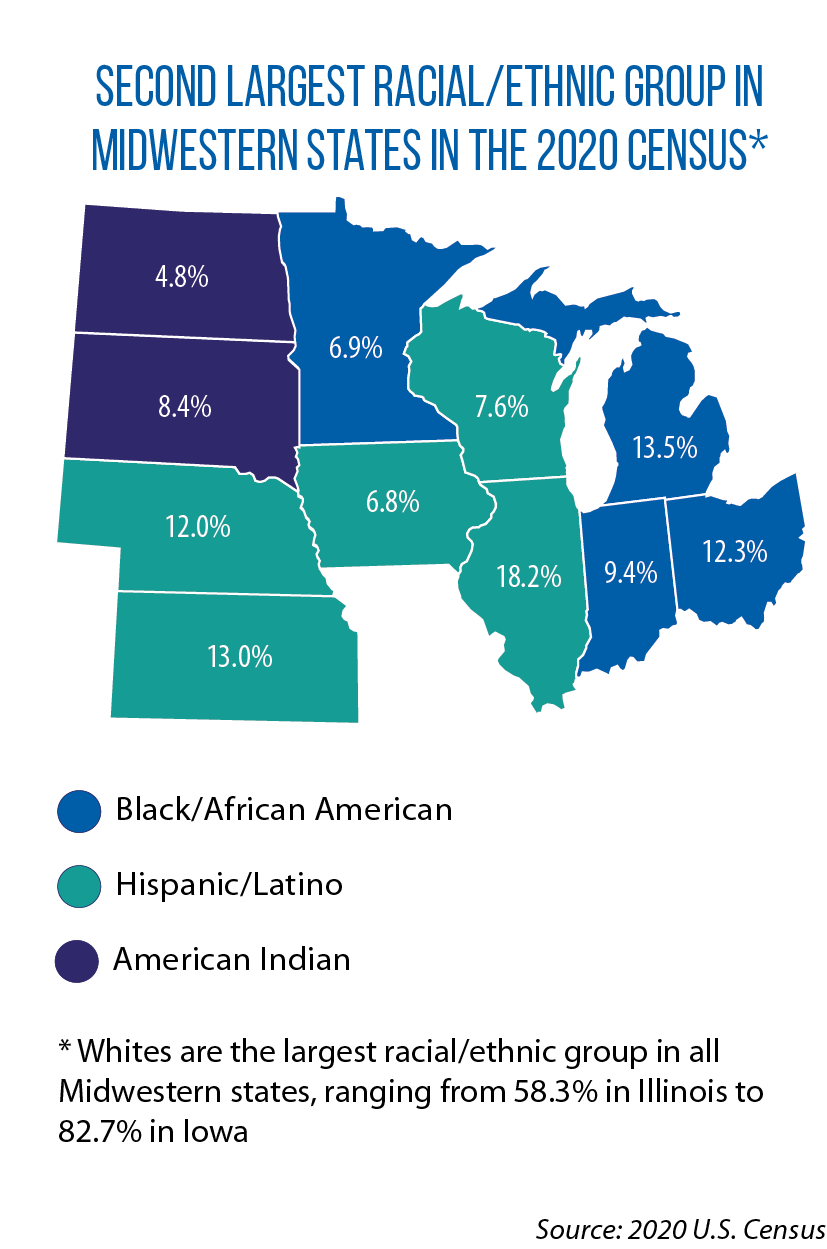
Even so, “the biggest thing that happened during the last decade, that the census is reflecting, is that many immigrant groups, Latinx or Asians, skipped the cities and moved directly to the suburbs,” says Dick Simpson, a professor of political science at the University of Illinois at Chicago and a former Chicago alderman.
“You’ll begin to see more Latinx and Asian legislators, and more political empowerment for those groups,” Simpson says. “It’s already under way.”
In recent years in the Midwest, for example, Illinois Rep. Theresa Mah and Wisconsin Rep. Francesca Hong became their states’ first Asian legislators — in 2016 and 2020, respectively. Also in 2020, Illinois Sen. Ram Villivalam became his chamber’s first Asian (and first Indian-American) member.
The suburbs’ increasing diversity can also bring surprising shifts in power, Simpson says.
Not too long ago, for example, a very heavily Republican DuPage County acted as a counterweight to equally Democratic Cook County, keeping Illinois more or less equally divided politically, he says.
But because Democrats made major inroads in the suburbs in the last 20 to 30 years, Republicans now struggle much more than before, which leaves the Democrats in control at the state level.