2023 MLC Chair’s Initiative on Food Security | Rates of ‘food insecure’ households vary in Midwest; state policy is one of many factors
Over the course of the past year, did you have enough food, at all times, for an active, healthy life?
For people in most U.S. households, the answer is “yes.” Close to 90 percent of households were “food secure” in 2021. But that leaves more than 9 million U.S. children and more than 24 million adults living in a household with some degree of “food insecurity,” including some households reporting “low” or “very low” levels of food security.
 In support of the yearlong Midwestern Legislative Conference Chair’s Initiative of Michigan Sen. Roger Victory on “Food Security: Feeding the Future,” a series of articles on this topic is appearing in Stateline Midwest in 2023. Here, we share regional and U.S. data on food insecurity, as well as on the nation’s leading hunger-fighting program: the Supplemental Nutrition Assistance Program, or SNAP.
Impact of state- and household-level characteristics on food insecurity
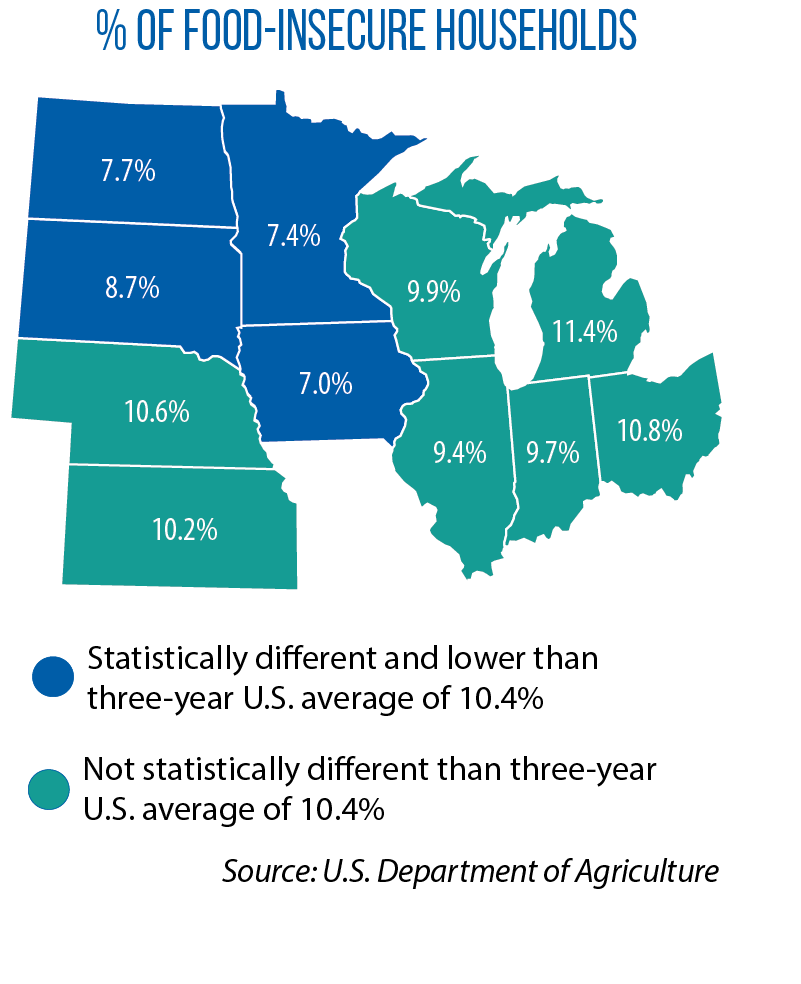
Nationwide, the rate of food-insecure households is 10.4 percent (when averaging the years 2019, 2020 and 2021). Four Midwestern states — Iowa, Minnesota, North Dakota and South Dakota — have a “statistically significant” lower rate than the national average. Every other state in the region is close to the national average, according to the U.S. Department of Agriculture’s “Household Food Security in the United States in 2021.”
 Authors of the USDA report cite several contributors to the state-by-state variations. On the policy side, state laws and programs affect access to unemployment insurance, nutrition assistance and the earned income tax credit. In turn, access to these as well as other safety-net and/or anti-poverty programs influences rates of food insecurity.
Differences in state-level economic characteristics play a role as well. For example, lower average wages lead to higher rates of food insecurity, as do higher housing costs and unemployment rates.
At the household level, families with children have higher-than-average rates of food insecurity (12.5 percent in 2021). This is especially true of households with children headed by a female with no spouse. Nearly 1 in 4 of these households report being food insecure, compared to 7.4 percent of married-couple households.
A ‘meal gap’ in Midwest’s rural areas, and among several minority groups
According to the hunger-relief organization Feeding America, which tracks county-level data for its “Map the Meal Gap” study, 89 percent of the U.S. counties with the highest rates of food insecurity are rural.
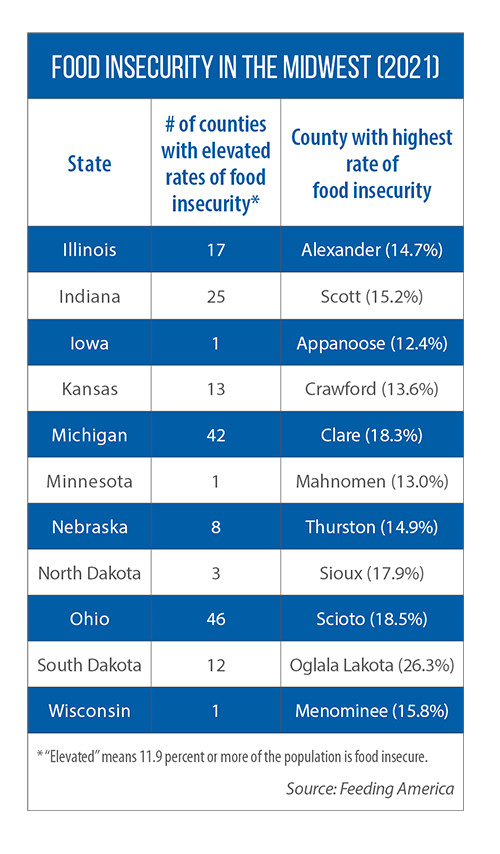 This kind of rural-urban gap is seen in the data for the 11-state Midwest, where most counties with elevated rates of food insecurity (11.9 percent or more of the population) are rural. Michigan, for instance, has 42 such counties, and nearly all of them are concentrated in the state’s northern region and Upper Peninsula. Many of Ohio’s 46 counties with higher-than-average food-insecurity rates are in the southeast part of the state.
In South Dakota’s Oglala Lakota County, 26.3 percent of the residents report being “food insecure,” one of the nation’s highest rates. This county has a mostly Native American population. In four other Midwestern states (Minnesota, Nebraska, North Dakota and Wisconsin), the counties with the highest rates of food insecurity also have high numbers of Native Americans.
According to Feeding America, of the 34 million people in the United States experiencing food insecurity, 8.2 percent are Native American, a group that makes up less than 3 percent of the U.S. population.
The USDA study found higher rates of food insecurity among Black and Hispanic households, 19.8 percent and 16.2 percent, respectively. That compares to 7.0 percent of White households.
Rates of SNAP participation in Midwest
 Every month, around 40 million Americans receive financial help with food purchases via the Supplemental Nutrition Assistance Program, or SNAP. It is the nation’s largest hunger-fighting program, providing benefits via an electronic benefits transfer card that is only redeemable for food purchases. In fiscal year 2022, the average monthly benefit, per household, was $438.99.
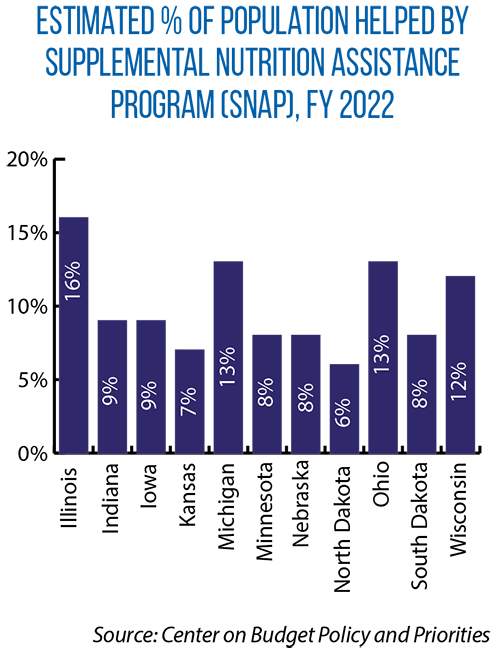
According to the Center on Budget and Policy Priorities, the percentage of state residents in the Midwest participating in SNAP in FY 2022 ranged from a high of 16 percent in Illinois to a low of 6 percent in North Dakota (see bar chart). Nationwide, the center says, more than 65 percent of SNAP participants are in families with children; 36 percent are in families with members who are older adults or disabled; and 41 percent are in working families.
Recent state-level changes to SNAP
In 2023, state legislatures in the Midwest considered many measures related to SNAP, a reflection of the central role that states play in program administration and policy decisions. For example:
 In Iowa, households no longer qualify for SNAP if they have assets that exceed $15,000, excluding the value of a home, a car and up to $10,000 of the value of a second car. The new law (SF 494) also establishes a statutory income limit on SNAP eligibility, at 160 percent of the federal poverty level. Additionally, the measure includes new requirements for program administrators and SNAP applicants in areas such as eligibility verification and identity authentication.
- Last year, Kansas (HB 2448) established new statutory language regarding work requirements for able-bodied adults without dependents between the ages of 18 and 49. To receive SNAP benefits, these individuals must be employed 30 hours a week or be enrolled in an employment or training program. This year, with the successful override of a gubernatorial veto, legislators passed HB 2094, which makes 50- to 59-year-olds subject to this same requirement.
- Indiana’s recently enacted SB 334 simplifies the application process for elderly and disabled residents seeking SNAP benefits. The new law also lengthens to 36 months the certification period for these individuals, reducing the frequency in which they need to recertify eligibility.
- Two years ago, Nebraska temporarily raised its SNAP income threshold from 130 percent to 165 percent. This expansion was set to sunset in 2023. Nebraska legislators, though, voted to keep the higher threshold with this year’s passage of LB 227.
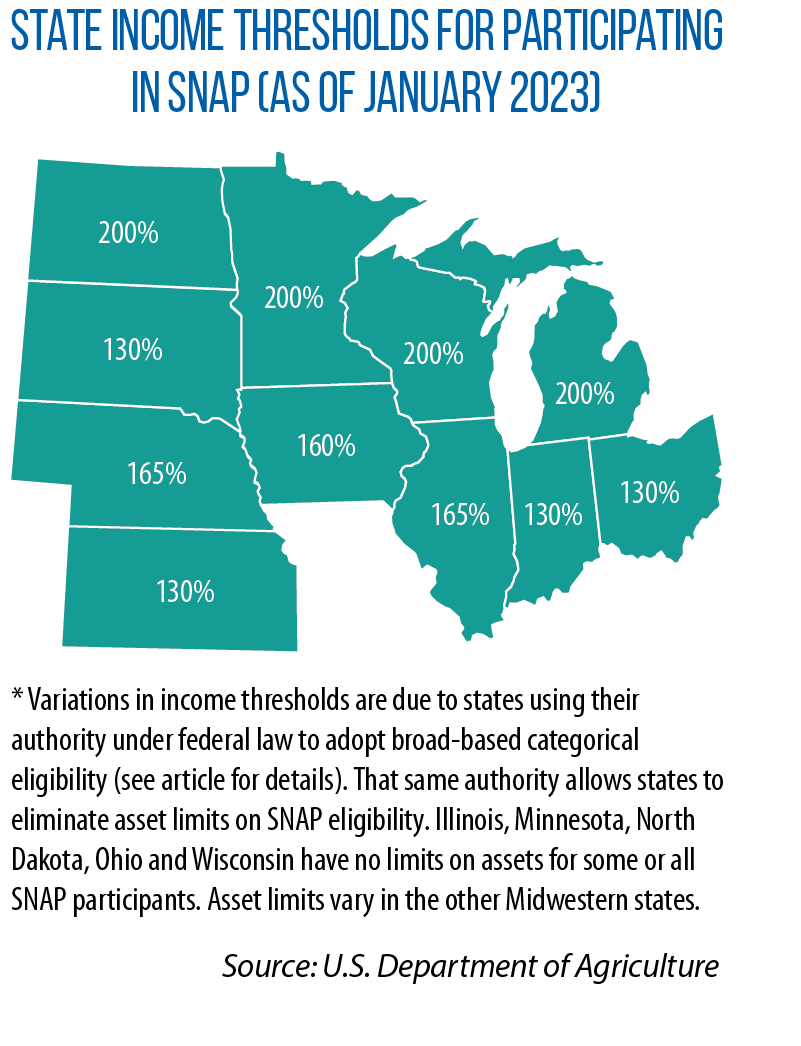
The actions in Nebraska are possible because of a provision in federal policy that allows states to offer broad-based categorical eligibility: make households “categorically eligible” for SNAP if they receive benefits from other means-tested, low-income assistance programs.
States use this policy to raise income eligibility thresholds and remove asset limits, thus making more households eligible for federally funded SNAP benefits. Without state implementation of broad-based categorical eligibility, SNAP participation is limited to households with gross income at or below 130 percent of the federal poverty level and, as of FY 2022, households with liquid assets below $2,500 ($3,750 for the elderly and disabled).
Every Midwestern state except Kansas and South Dakota uses broad-based categorical eligibility for SNAP. One result is varying income thresholds across states.
Michigan Sen. Roger Victory chose “Food Security: Feeding the Future” as his CSG Midwestern Legislative Conference Chair’s Initiative for 2023. CSG Midwest produced a series of articles, policy research and interstate sessions for legislators in support of this initiative.