Demographic shifts include more deaths, fewer births and new domestic migration patterns
Close to three-quarters of the nation’s U.S. counties experienced a “natural decrease” in population in 2021, with the number of deaths exceeding births due to factors such as an aging population, the effects of COVID-19 and an overall increase in mortality rates.
This recent demographic shift (traditionally, most states and their counties have had “natural increases”) means population growth in many parts of the country must now come from migration, either international or domestic. And at least at the start of this new decade, some of the nation’s medium- and smaller-sized counties have still been able to grow thanks to another change: people moving to these areas from more-populous ones, according to new data and analysis from the U.S. Census Bureau.
“The patterns we’ve observed in domestic migration shifted in 2021,” notes Christine Hartley, assistant division chief for estimates and projections in the bureau’s population division. “Even though over time we’ve seen a higher number of counties with natural decrease, and net international migration [is] continuing to decline, in the past year, the contribution of domestic migration counteracted these trends.”
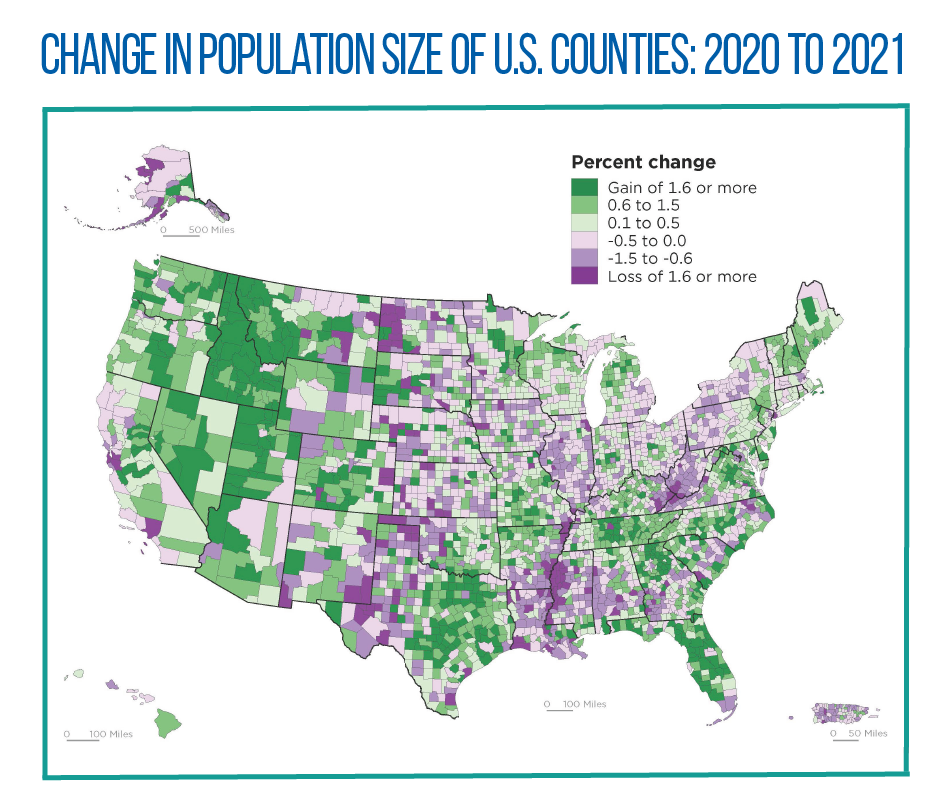
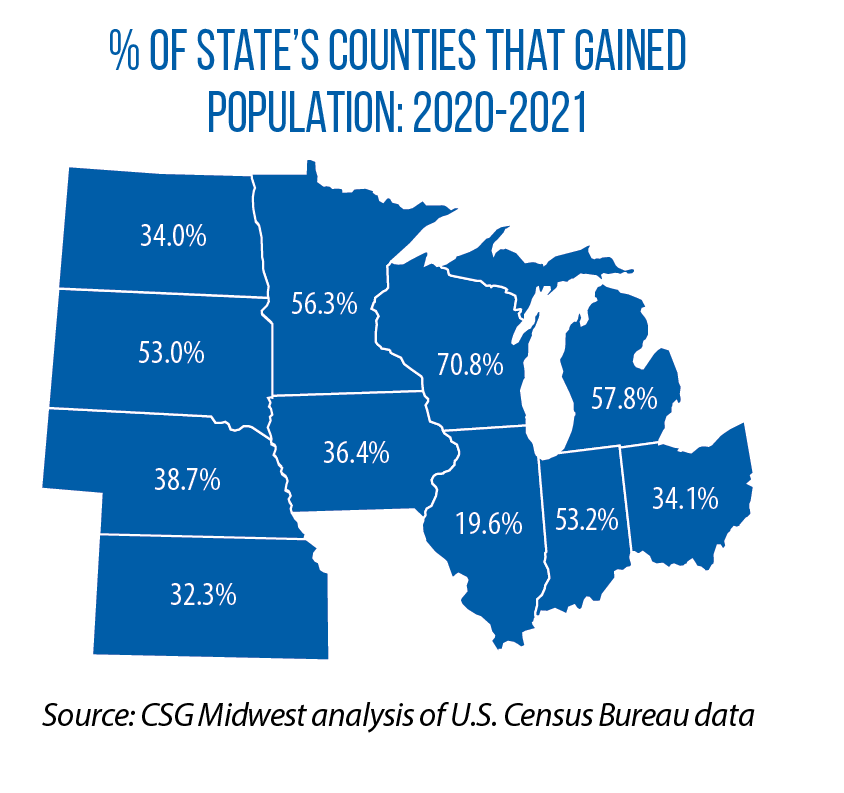
Between 2020 and 2021, 58 percent of U.S. counties grew. However, these increases are concentrated in the western and southern parts of the United States, as the Census Bureau map shows (shades of green represent population growth, shades of purple represent declines). In the 11-state Midwest, the percentage of counties that grew between 2020 and 2021 ranged from a low of 19.6 percent in Illinois to a high of 70.8 percent in Wisconsin (see map).
The recent U.S. Census Bureau data also show considerable variation in how domestic migration is impacting overall population in the region’s states. For example, Illinois experienced a net loss of 113,776 people due to domestic migration between 2020 and 2021. In contrast, neighboring Indiana gained 14,280 residents. Here are the data on net domestic migration for the other nine Midwestern states during the first two years of this decade.
- Iowa — gained 833 people
- Kansas — lost 5,241 people
- Michigan — lost 7,893 people
- Minnesota — gained 13,453 people
- Nebraska — lost 3,313 people
- North Dakota — lost 6,460 people
- Ohio — lost 3,128 people
- South Dakota — gained 5,564 people
- Wisconsin — gained 3,307 people